Chapter 2 Solutions Class 12 Chemistry Maharashtra Board Textbook Solution
7. Explain with diagram the boiling point elevation in terms of vapour pressure
lowering.
Answer:-
(1) The boiling point of a liquid is the temperature at which the vapour pressure of the liquid becomes equal to the external pressure, generally 1 atm (101.3 × 10³ Nm-2).
(2) When a liquid is heated, its vapour pressure rises till it becomes equal to the external pressure.
If the liquid has a low vapour pressure, it has a higher boiling point.
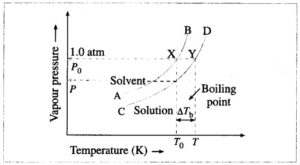
Vapour pressure curve showing elevation in boiling point
(3) When a nonvolatile solute is added to a solvent, its vapour pressure decreases, hence the boiling point increases.
This is explained by graphical representation of the vapour pressure and the boiling point of the pure solvent and the solution.
If T0 and T are the boiling points of a pure solvent and a solution, then the elevation in the boiling point is given by,
ΔTb = T – T0
The curve AB, represents the variation in the vapour pressure of a pure solvent with temperature while curve CD represents the variation in the vapour pressure of the solution.
(4) This elevation in the boiling point is proportional to the lowering of the vapour pressure, i.e., P0 – P, where P0 and P are the vapour pressures of the pure solvent and the solution.
[ΔTb ∝ (P0 – P) or ΔTb ∝ ΔP]
Chapter 2 Solutions Class 12 Chemistry Maharashtra Board Textbook Solution
Question bank with Solution
Text book Solution
NCERT Solutions
NCERT Solutions for Class 12 Maths
NCERT Solutions for Class 12 Physics
NCERT Solutions for Class 12 Chemistry
NCERT Solutions for Class 12 Biology
NCERT Solutions for Class 11 Maths
NCERT Solutions for Class 11 Physics
NCERT Solutions for Class 11 Chemistry
NCERT Solutions for Class 11 Biology
NCERT Solutions for Class 10 Maths
NCERT Solutions for Class 10 Science
Board/University Study Material
Question Paper Solutions
CBSE Previous Year Question Paper With Solution for Class 12 Arts
CBSE Previous Year Question Paper With Solution for Class 12 Commerce
CBSE Previous Year Question Paper With Solution for Class 12 Science
CBSE Previous Year Question Paper With Solution for Class 10
Maharashtra State Board Previous Year Question Paper With Solution for Class 12 Arts
Maharashtra State Board Previous Year Question Paper With Solution for Class 12 Commerce
Maharashtra State Board Previous Year Question Paper With Solution for Class 12 Science
Maharashtra State Board Previous Year Questio n Paper With Solution for Class 10
CISCE ICSE / ISC Board Previous Year Question Paper With Solution for Class 12 Arts
CISCE ICSE / ISC Board Previous Year Question Paper With Solution for Class 12 Commerce
CISCE ICSE / ISC Board Previous Year Question Paper With Solution for Class 12 Science
CISCE ICSE / ISC Board Previous Year Question Paper With Solution for Class 10